JOINTS 2026 · Team project
Pavana
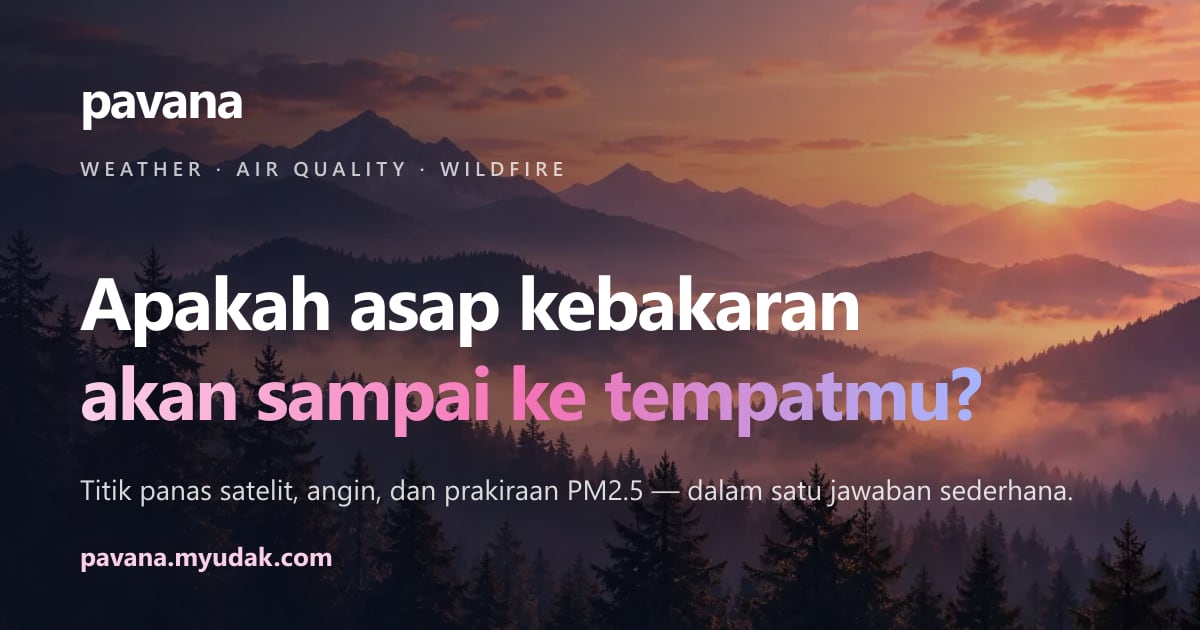
Pavana is a JOINTS 2026 prototype combining satellite hotspots, wind, and PM2.5 forecasts to help people understand air quality and wildfire smoke in Indonesia.
Pavana brings satellite hotspot detections, weather, and air-quality forecasts into a location-based interface for Indonesia. Our team built it for the Sustainability subtheme of JOINTS 2026, with Kubu Raya, Kalimantan Barat, as the demo region.
The product starts with a question in Bahasa Indonesia: “Bagaimana kondisi udara di tempatku?” Someone opening the app should be able to understand the current conditions, see what may change, and inspect the sources behind the answer.
From scattered data to a local picture
Hotspot maps, wind forecasts, and PM2.5 estimates answer different questions. A nearby satellite detection alone cannot tell someone whether smoke is affecting their location. Pavana puts those signals next to each other while keeping their meaning visible.
The web interface includes:
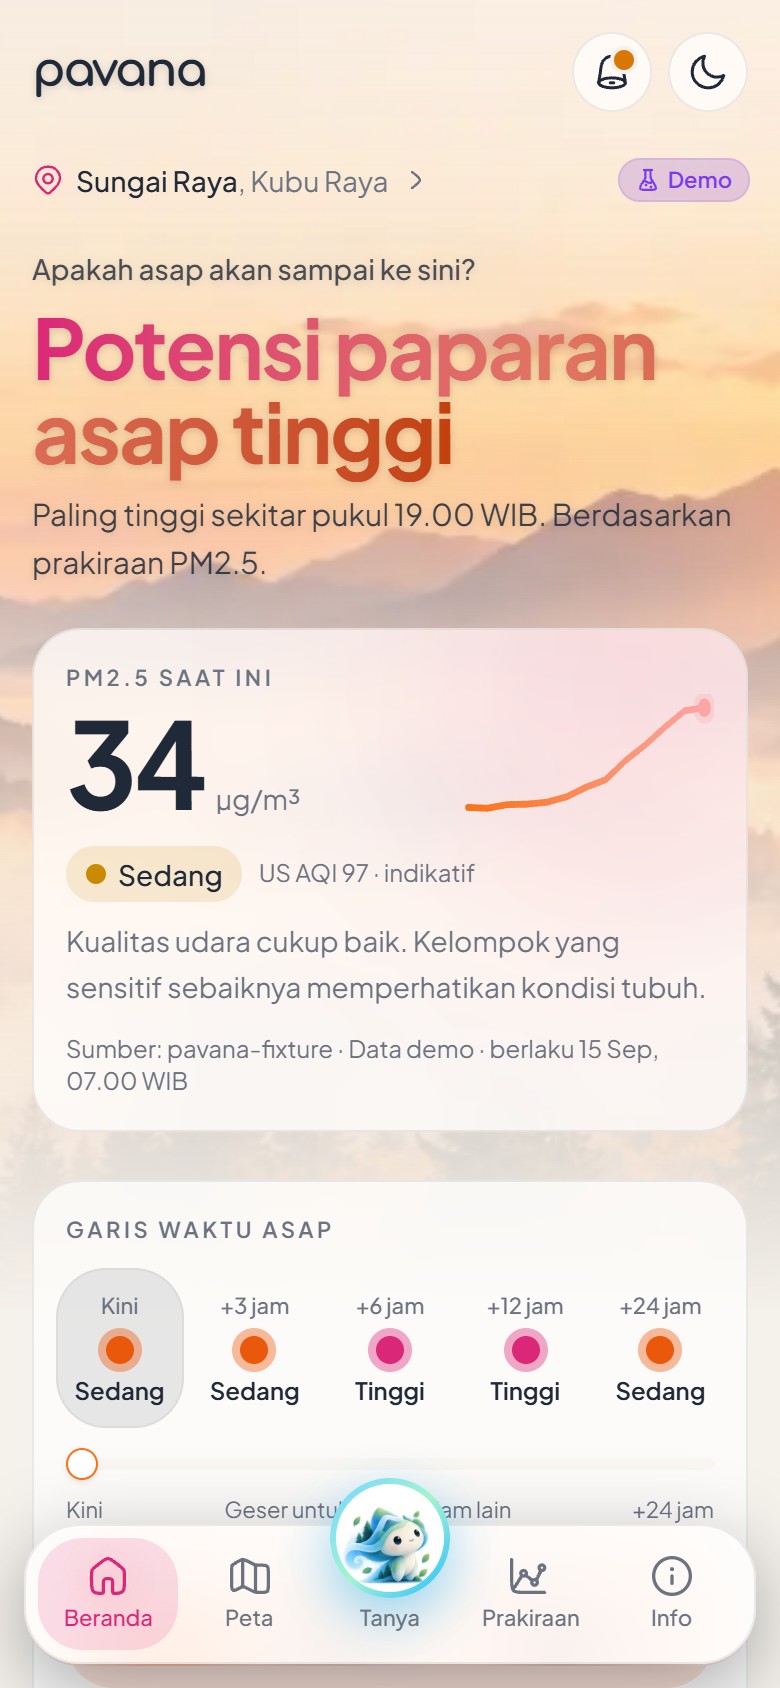
- A location picker and a summary of air quality and weather.
- Hourly forecasts with source information and update times.
- A MapLibre map for hotspot detections and wind context.
- Experimental model outputs for hotspot risk, airport haze, and airport wind.
- Tanya Pavi, an assistant grounded in the selected location’s Pavana data.
- Links to official information for further checking.
An Expo mobile app uses the same API contracts. The public landing page introduces the product and links into the app.
Keeping the sources visible
The backend includes adapters for NASA FIRMS hotspot detections, Open-Meteo weather and CAMS air-quality forecasts, OpenAQ and BMKG observations where available, and airport METAR reports for model inputs.
Each value carries its provider, timestamp, and data type. Observation, forecast, derived indicator, and demo fixture are distinct states. Missing values stay missing; they do not become a zero reading or a reassuring status.
The distinction also shapes the wording. A hotspot is a satellite detection, not a confirmed fire. CAMS PM2.5 is a forecast of total particulate matter, not a measurement of smoke from one particular fire. Wind provides transport context, not a guaranteed smoke-arrival time.
Architecture
The React web app and Expo mobile app talk to a Fastify API written in TypeScript. Shared Zod schemas validate provider data, API responses, and client-side parsing. Shared functions handle distance, wind direction, air-quality categories, and deterministic indicators.
Data providers → Fastify API → React web / Expo mobile
                     ↑
Python training → Frozen model JSON
Python is used for offline research and training, including Kaggle workflows. Trained LightGBM models are exported to JSON and evaluated in TypeScript by the API. The web client does not need a separate Python inference server.
In live mode, Tanya Pavi receives a structured snapshot of the selected location’s data through a server-side OpenRouter integration. Demo mode uses scripted answers. Provider credentials remain on the server.
Experimental models
The prototype serves next-day hotspot-risk estimates, airport haze estimates at 6- and 24-hour horizons, and airport wind estimates at a 6-hour horizon. These outputs are explicitly experimental. They are not operational forecasts or official warnings.
PM2.5 modelling has a separate constraint: an observed historical target is needed to evaluate an independent prediction model. The CAMS-targeted experiment remains research-only rather than being presented as a validated local PM2.5 model.
Demo and project status
Pavana includes a labelled synthetic scenario for repeatable demonstrations. Other model demo paths replay archived inputs. The interface distinguishes demo data from live data and shows unavailable or stale inputs explicitly.
This is a hackathon prototype, not an emergency service or an evacuation tool. It does not confirm fires, determine that a home is safe, or issue official alerts. Its purpose is to make environmental information easier to inspect and understand.
Explore the Pavana website or read the source and technical documentation on GitHub.